NanoVNA linearity

Over the past few months, considerable work has been done with the NanoVNA, an excellent compact vector network analyzer that performs well up to around 300 MHz. However, the available dynamic range is somewhat limited, comparable to that of an HP8410 at 10 GHz. The following measurements were performed to evaluate an original NanoVNA-H4.

One challenge encountered was when measuring amplifiers. For a portion of the amplifier’s range, there was clear evidence of compression. But was it the VNA, the amplifier, or some other factor causing it? This led to the development of a setup to measure the compression point of the NanoVNA.

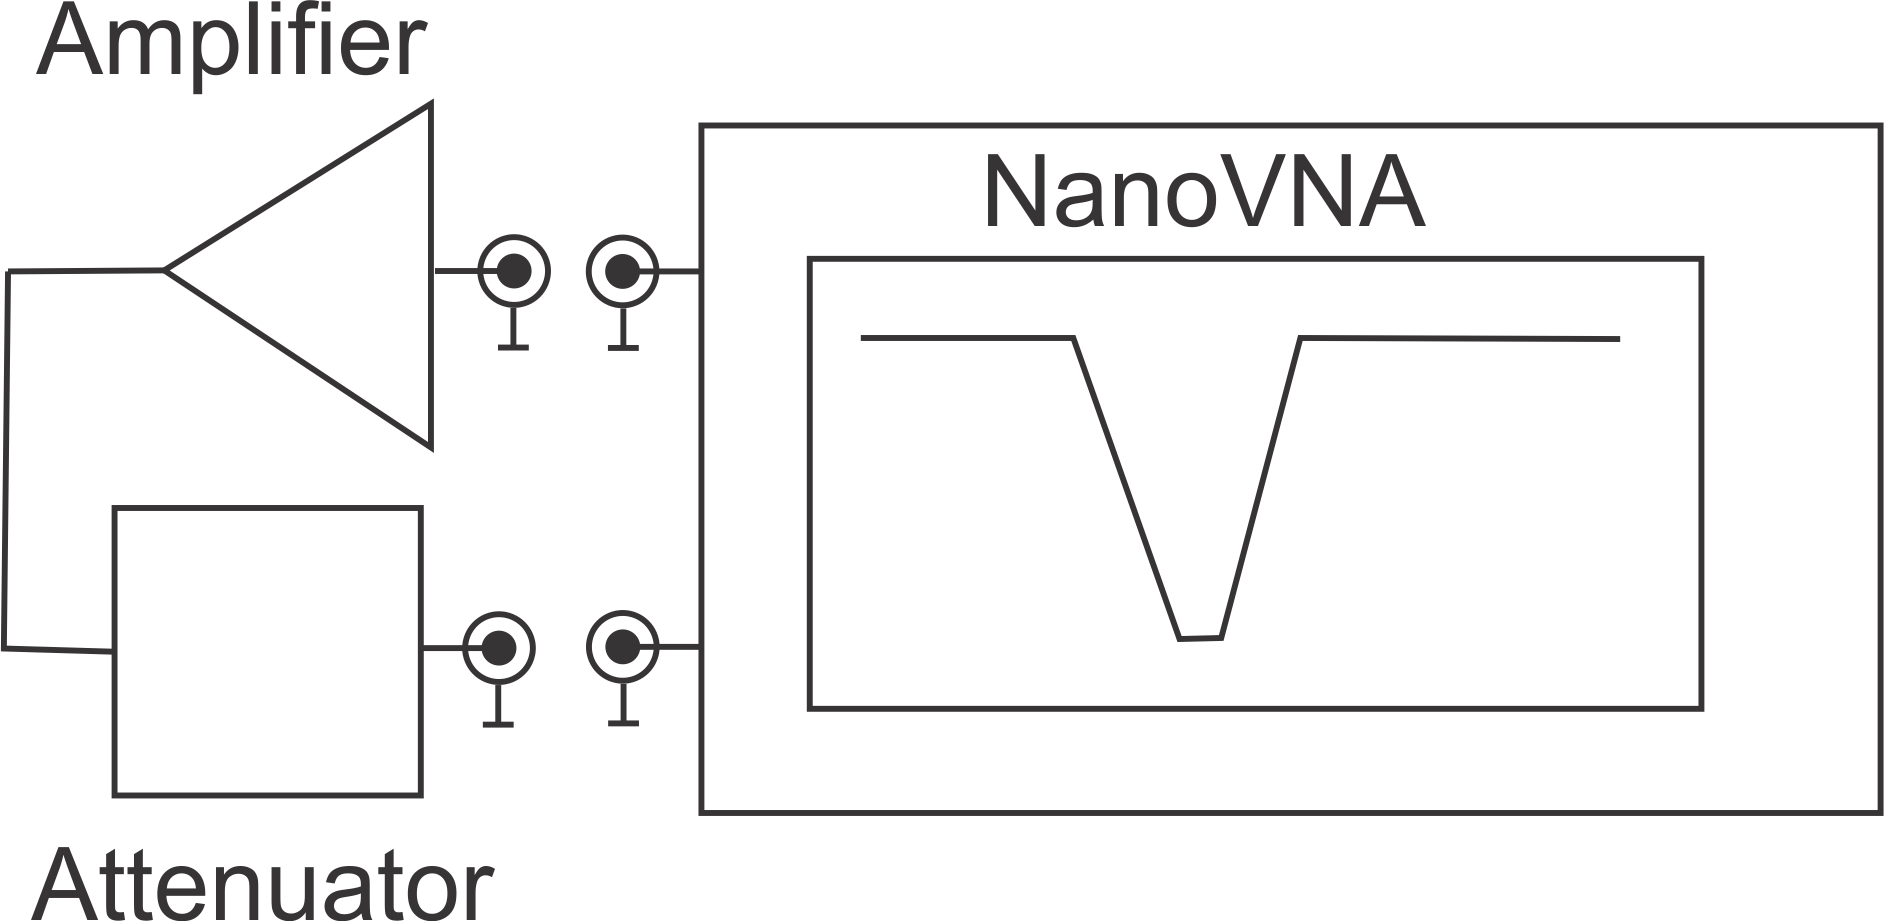
The setup included the NanoVNA, calibrated using a SOLT (Short, Open, Load, Through) procedure, with the shortest possible coaxial cable to ensure a 0 dB S21 response. A proper amplifier (Mini-Circuits ZFL-1000H) was used, terminated with a 6 dB attenuator, followed by a programmable attenuator. The amplifier’s output was measured at a single frequency while adjusting the attenuator. This ensured that the input level to the amplifier and the impedance remained consistent across all measurements, minimizing inaccuracies.

A Python script controlled the process, automating the reading of the NanoVNA, adjusting the attenuator, and taking new measurements. The NanoVNA’s power mode was set to “AUTO” during these measurements, as it was found to provide more consistent power compared to manual output settings.

The results are as follows:

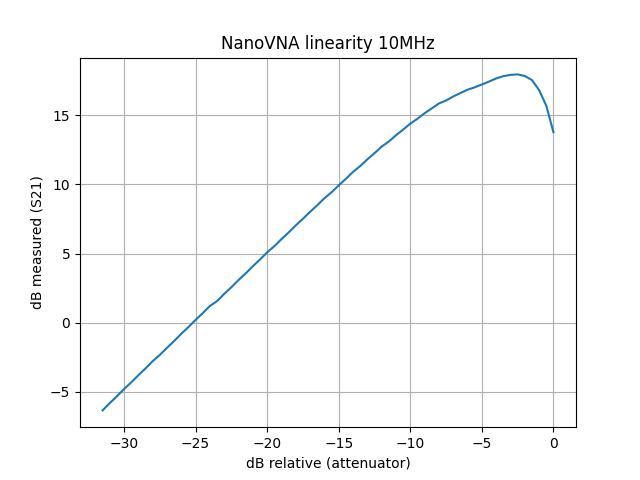
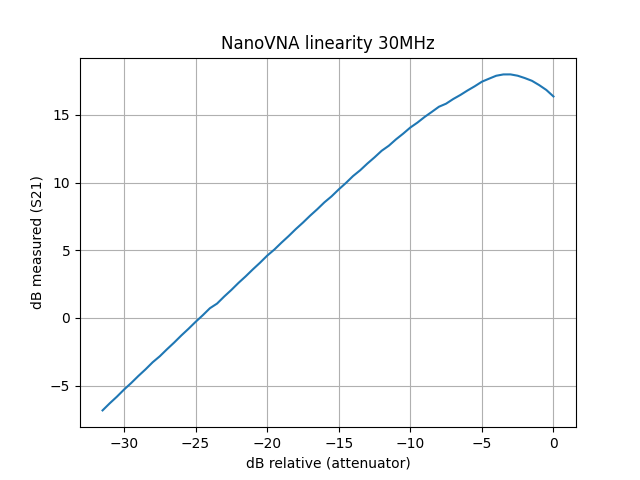
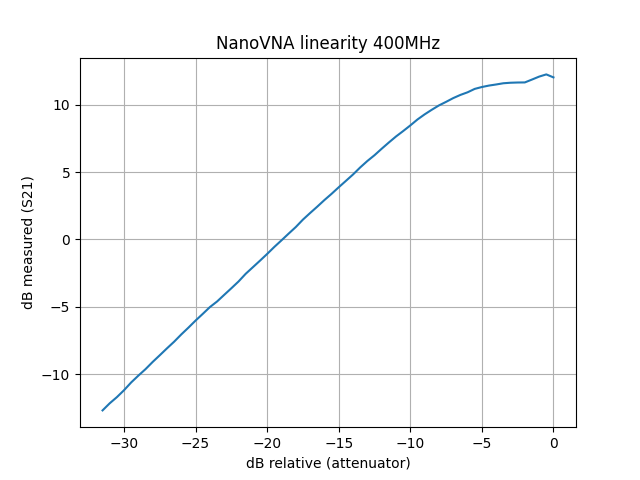
The data is plotted with the attenuator value on the X-axis and the measured output on the Y-axis. At HF frequencies, the results were satisfactory. It is generally safe to measure an amplifier with up to 10 dB gain connected directly to the VNA, but for amplifiers with higher gain, either the VNA’s output power should be reduced, or an external attenuator should be used on port 2. Above 200 MHz, there was little change in the compression point until around 300 MHz, where the VNA begins using the third harmonic for detection. As expected, this resulted in a lower compression point.

The disappointing part occurred above 600 MHz, where the VNA relies on the fifth harmonic. Here, the compression point decreased with increasing frequency. Interestingly, there was a specific power level at which the reported output was -24 dB. This value was consistently observed, and after multiple tests with different amplifiers and attenuators, it was determined to be an actual response of the NanoVNA, not a measurement artifact.

For those using the NanoVNA to measure amplifiers, it is recommended to proceed with caution when dealing with amplifiers that have high gain. Be sure to adjust the VNA’s output power or include external attenuation to avoid distortion in the measurements.

Thermocouple meter and datalogger

I have designed a thermocouple meter for use for obtaining temperature readings from thermocouples. Its used together with the thermal chamber described elsewhere on this site.

IMG_4367

The design is done primarily as a programmable instrument, but it has a OLED display, so it can show the current temperature.  The programming uses SCPI, the same type of programming strings that most newer (1990 forward) instruments use.

The meter consists of a Empyrean microcontroller from Etherkit and a couple of MAX31855 thermocouple amplifiers. For the MAX31855 it is important to get them from a reputable source, not ebay or aliexpress as there is a lot of fakes around.  Display, connectors for the thermocouples and such parts are from ebay.

This design requires a Etherkit Empyrean or other SAMD21 series microcontroller. It will not work with other arduino boards.

The enclosure used is a cheap e-bay case 100x75x35mm. For this I have selected to mill out new font and back panels.

There are 2 PCBs that interlock on this design, a main PCB that fits the enclosure and holds most of the parts and a display PCB for fixing the display in the correct position.

IMG_4368

The greenwires are fixed in the last version of the board.

There is a planned extention header (8 pole connector) for a 2. board of thermocouple amplifiers. This way the meter can measure up to 4 points in the same meter.

A couple future points that should be inproved up on is the voltage regulator. This should be replaced with a small switch mode regulator to 5V and a linear regulator down to  3.3V. This have been used in several of my other design and I consider that a building block now. Correctly build it radiates no detectable noise.

Another point of improvement is that USB is finky at best. It would be better to replace this with a network connection. Experience is that USB times out after a while and that interrupts measurement over longer periods. Adding a network card should be easy and there is plenty of space in the microcontroller.

Feel free to try it, change the code and play around with it. A limited amount of PCB’s and panels may be available from me.

cadlab.io files

github for this project

Etherkit Empyrean

NIST on phase detectors and some verification.

NIST has some interesting articles on their website, one of them being a 5 MHz phase detector with low residual flicker [1] for measuring phase noise.  This spurred some discussions and a series of measurements on my part.

mixer_pd_sch

The interesting part is the usage of common 2N2222 transistors.  There have been some discussion on the internet about the outlined connection of the transistor as a diode with the BC junction shorted. Some claiming it behaving as a switch, while others claiming it to be a diode. My own suspicion was that this would act as a diode, and a mixer was built tusing BC547B’s.  A quick look at my crude curve tracer shows the diode action:

ct_diode_bc547

The mixer uses a 5:1 transformer for optimal impedance match, and I was not able to find a pair in my junkbox.  Using FT-2402-43 cores, with a 2t primary, and a bifilar 4.5 turns secondary winding. 4 diode connected transistors and the mixer is working.

Mixing action was verified on a spectrum analyzer before compression points were measured used the 30% am technique.

compression_bc547mixer


As can be clearly seen, as long as the diodes are conducting, the mixing action is linear.  With the low LO amplitude of 0dBm, the diodes are not conducting properly and that can be shown on the plot of the linearity. Notice that the mixer is in compression with as low as -8dBm input level. The bend and slope with 17dBm LO is somewhat larger than for the lower amplitudes, indicating that the mixer LO may be excessive. Some spectrum analyzer plots showing the IMD products should give further insight into this, if used as a mixer.

nist_mix_spectr

As a last test, I did try to use this phase detector to measure phase noise, using my current setup.  Unfortunately there was little change compared to the much more noisy level 7 mixer it has. This is due to the noise in the low noise amplifier that follows the phase detector and masks any improvement in the phase detector for now.  A new, 100pV/sqrt Hz input noise amplifier is planned.


[1] https://tf.nist.gov/general/pdf/2554.pdf


Note 18 nov 19:

Did a measurement of IL vs LO level at different frequencies:

IL_NIST

Note 22 june 2020:

Homemade thermal test chamber

Some time back (2016 timeframe) I built a test chamber out of an inexpensive freezer, after having several project that required taking some thermal data over the expected useable range.  I was looking for a used laboratory freezer that goes down to -60° or lower, but none seems available used.

IMG_1528

The freezer uses “pentane C” cooling media,  and the initial test suggested that before modification, the freezer, with the pump running all the time would go down to -26°C.

After confirming that the freezer would work, it was time to void the warranty. What better way, than by drilling a hole through the side of the freezer?

IMG_1530

I choose to drill through the plastic with a small pilot drill, then poke around to see if there was any cooling tubes in the side. That way I hopefully I would be able to avoid cutting any of the tubes.  Given that I couldn’t feel anything in the foam insulation, it was time for the hole saw.  With a hole through the side of the bottom compartment, a 36mm plastic tube was fitted, some foam spray was used to fix the defects and some clear silicone sealed the gap between the tube and the side of the freezer.

The idea I started with was to make a proper, insulated patch panel, with both coax and DC connectors, but after some thinking, the tube filled with a rag seemed like a more flexible approach.

IMG_1536

Ripping out the thermostat and sensor tube was quite easy, threading the sensor cable for a ready-made 1-wire sensor (got this via bobcatinabox.com some time back). Drilling a hole in the wall of the  small compartment was done by poking through the insulation from the back with a pice of wire, then when confirming it was clear off the cooling tubes and drilling through.

A 12V PTC heater with fan was modified so that the fan can run all the time, and fitted to the shelf. This way there will be constant air circulation inside, and the heater can be controlled by the microcontroller.

On the back of the freezer,  the connector block for the freezer had an unused terminal that was repurposed as a terminal for the live wire that before had gone to the thermostat. A 12V 20A switch mode power supply was added, and fixed to the back wall with a couple M3 screws and nuts.

IMG_1542

A Arduino was fixed above the power supply, and a small pice of wearoboard with some relays and driver transistors to switch the power to the pump motor and to the heater.

The program running on the microcontroller is a fuzzy logic implementation with a 2°C hysteris. There is also some timing logic to not turn on the pump before the back pressure has bled trough, or the fuse will blow.  I started out with some SCR’s but the cheap eBay SCR I bought had too much loss before it caught fire.

The program can be found here: https://github.com/la3pna/thermal-chamber

I intend to implement a proper dual PID for the controller one day, as keeping temperatures within 0.5°C should not be too difficult. Adding network interface in addition to the USB and a propper way of handling those messages would make it more versatile.

There is currently no cap on how hot it can become inside, but I suspect the plastic casing will not take well to having it run at high temperature for long time.

The inside usable size is approx 320x320x180mm, so there is no way of fitting a 19″ rack in there, but for smaller parts, it will do OK.  Now I just need to build the multiple termocouple amplifiers into a box with some method of reading it out.

An example of measured data:

tcxo


IMD measurment generator

IMD or Intermodulation distortion testing is in RF systems usually done with 2 signal sources, quite close in frequency, and one determines the level of the unwanted responses. The actual measurement procedure is shown quite well other places in the literature [1].

Here I will show my design for an high performance crystal controlled RF source delivering 100mW or so into 50 ohm at HF. The obtained phase noise from this generator are better than the resolving bandwidth of my phase noise measurement -140dBc so there should not be any problems from the phase noise of the signals.

final_schematic

The oscillator circuit used is an common base Butler circuit, as described in Matthys [2]. There are a total of 5 frequency dependent components, the crystal, the inductor, and 3 capacitors. The oscillator have limiting to reduce the oscillation amplitude and to improve the frequency drift.

values

C5+C8 is selected such that the middle value falls in the center of the trimmer C5 range. The chosen crystal should be an HC49 size, not one of the smaller models, as those tend to drift more than their larger counterparts. Measured drift for this oscillator on 3.7MHz is less than 10Hz from start (red trace). Crystals can be ordered from [3] or [4]. Crystal ovens are not recommended, if temperature drift is a problem, fit the crystal with an Styrofoam bead to insulate.

grr_drift

The oscillator is followed by an 3. order low-pass filter to remove harmonic products from the limiting of the oscillator. There exists several types of filter one can use if one wants, I have calculated the values for an half wave filter. This have the simplicity of calculation that the reactances of the components are equal to the system impedance. In this case, for an given frequency :

formula1
where f is the crystal operating frequency in Hz. Different filter topologies like Chebychew or Butterworth can be used to improve the harmonic attenuation of the filters. Information on the calculations of such filters can be found in [1]

Following the filter is an attenuator that can be inserted if the max output level is higher than the desired operating amplitude. Suitable attenuator values can be found several places on the internet. If not used, insert an 0 ohm resistor into R8.

The attenuator is followed by an variable gain hybrid cascade amplifier. This consists of an cascade of an J-fet (MMBT310) and an bipolar transistor (BC847). The J-fet is impedance matched to the 50 ohm system with an balun made by winding 4 turns bifilar on an BN-43-2402 ferrite binocular core. The output is in an similar way matched to the power amplifier with an transformer wound on an BN-43-2402 core. The primary side against the hybrid cascade consists of 12 turns, the side against the power amplifier consists of 2 turns. Wind these such that the leads protrude on each side of the core. The amplifier gain can be adjusted with the trimmer R11 such that the output amplitude is at an fixed level, or this can be taken to an potentiometer mounted in the box such that the output power can be varied if needed.

The power amplifier consists of an NE46134 medium power RF transistor, operating in class AB and delivering a nominal 100mW output power. The inductor is wound on an FT37-43 ferrite core, and 10 turns should suffice for all HF frequencies. Following this is an 5.th order low-pass filter. This filter uses the same capacitor and inductor values as calculated for the 3. order filter before. Observe that C23 is double the value of the other capacitors. The inductors should be wound on iron core toroids. T37 size is recommended. -2, -7 and -10 material should fit the frequency range from 2MHz to 50MHz.

IMD_source_plot

final_board

The PCB for this design is available from OSHpark:

https://oshpark.com/shared_projects/trtilfzL  3 boards for $36 with delivery worldwide.

The PCB have 2 small isolated holes on each side of the crystal and transformer to secure those to the PCB. The PCB is made to fit inside an Hammond 1590B die cast enclosure. All the used components are 0805 size. 1206 should fit, although a bit large.

In order to combine the generators, some kind of combiner is needed. There exists several kinds of couplers that are common to combine generators. 6dB hybrids are easy to construct and work over an large frequency range. For an small bandwidth range, like these crystal controlled oscilators, an Wilkinson divider gives 3dB split, and are easy to construct.

The PCB for the Wilkinson splitter can be ordered from OSHpark:

https://oshpark.com/shared_projects/9O4qDXVJ 3 boards for $9.90 with delivery worldwide.

wilkinson

A limited amount of kits may be available from me. Documentation and PCB files available on request.

[1] Hayward et. all, Experimental methods in RF design (EMRFD).
[2] Matthys, Crystal oscillator circuits.
[3] Expanded spectrum systems http://www.expandedspectrumsystems.com/prod4.html
[4] ICM https://www.icmfg.com/

open T-check

As of 24 mar 2018, I will no longer do any updates to the T-check program, I reccomend you try out KE5FX’s GPIB toolkit, as this has a similar program.

Ok, since this blog seems to be about the software I write, and not about RF engineering, altough this may be related.

T-check is an routine by R&S to verify the validity of network analyzer SOLT calibration.  This is explained in the R&S application note 1EZ43_0E, covering the math behind the routine as well as the T-checker, an coaxial adapter with an integrated 50 ohm resistor. An simplified method to realize this may be an T adapter with an 50 ohm termination on the 3. port.

t-check

The VNA is calibrated and this device is inserted instead of the DUT. The S-parameters are then saved and run through the T-checker program.

t-check

The program, as supplied from R&S does only work on 32bit computers.  I made an implementation that run on both 64bit and 32bit windows as well as linux, BSD, UNIX, OSX and even Playstation 3 with MONO.

My implementation, named “open T-check” are avaible here

Rigol oscilloscope waveform software

If you follow me on twitter, you may know that I have written an small application that  obtains the waveforms from the oscilloscope and plots it to an graph.

The orginal software and driver from Rigol did not work as it should, after trying several operating systems and computers, I gave up trying and decided on writing my own.

The Rigol oscilloscopes, and as far as I know, all of the other instruments support VISA. This means that the NI VISA driver set from National Instruments can be used as the interface between the program and the instrument, and we don’t have to worry about other than the high level communication.

Download the program here.

In order for the program to work, you need the NI-VISA:

Windows

MAC OS X

Linux (redhat/suse) 

On OSX and Linux, the program runs within MONO runtime.

scope1

Calibration: Set both inputs to GND and offset to 0V, read the waveform. If the graph is drawn in center of the screen, then all is ok, if not, save the CSV file, and experiment with the calibration value in order to get it in center.

Top of the screen = 25, bottom of the screen = 224 for my oscilloscope. This value is saved to an settings file and read when the program starts.

If neccesarry it should be possible to get the cal value read automaticaly from the scope.  In the future, I may implement Zedgraph for the graphing, but my experiences with it is a bit mixed.

The program is written in C# and the code is avaible here: https://github.com/la3pna/scope